

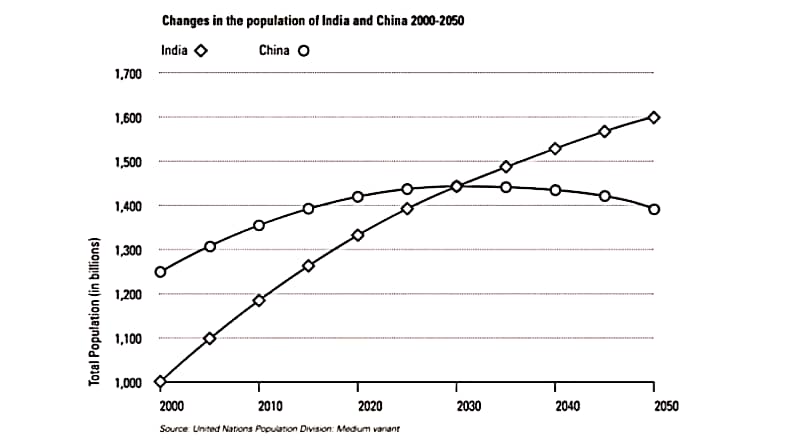
The line graph presents the total population in billions over the years in two different countries, India and China. The population of both the countries […]
Devamını okuEtiket: graph

India – China Graph Comparison
The graph illustrates the projected population trends of India and China from 2000 to 2050. In 2000, China had a larger population of approximately 1.26 […]
Devamını okuIllustration of the Population Graph
The graph illustrates the population changes in India and China from 2000 to 2050, including future projections. It compares the total population of both countries […]
Devamını oku
Writing Task
This is a graph about the population of India and China from the year 200 to the present day with projections for growth to the […]
Devamını okuThe Population Growth Graph of China and India
This graph illustrates a comparison between the chane of the populations, shown in billions, of India and China starting from […]
Devamını oku
The Increase of Population
The graph below gives information about the population increase of country two populous countries China and India between 2000-2050. This graphs also predicted the population […]
Devamını okuPopulations of China and India
The graph illustrates the population changes of India and China from 2000 to the present day, along with a guess for future growth up to […]
Devamını oku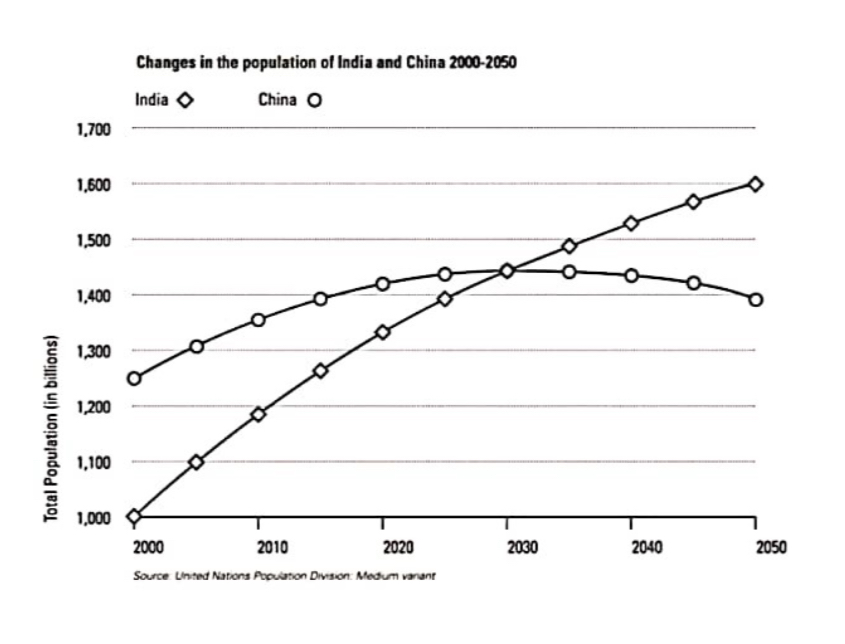
Population Trends of India and China: 2000-2050
The graph demonstrates the population trends of India and China from 2000 to the present, also extending to 2050. Both countries have experienced significant population […]
Devamını okuGraph Summarizing
The graph compares the population growth of India and China from the year 2000 to the present day with projections for growth to the year […]
Devamını oku